What Sold in Carlsbad, September 2026: House Prices Up 7%, Condos Down 5% Over Three Months
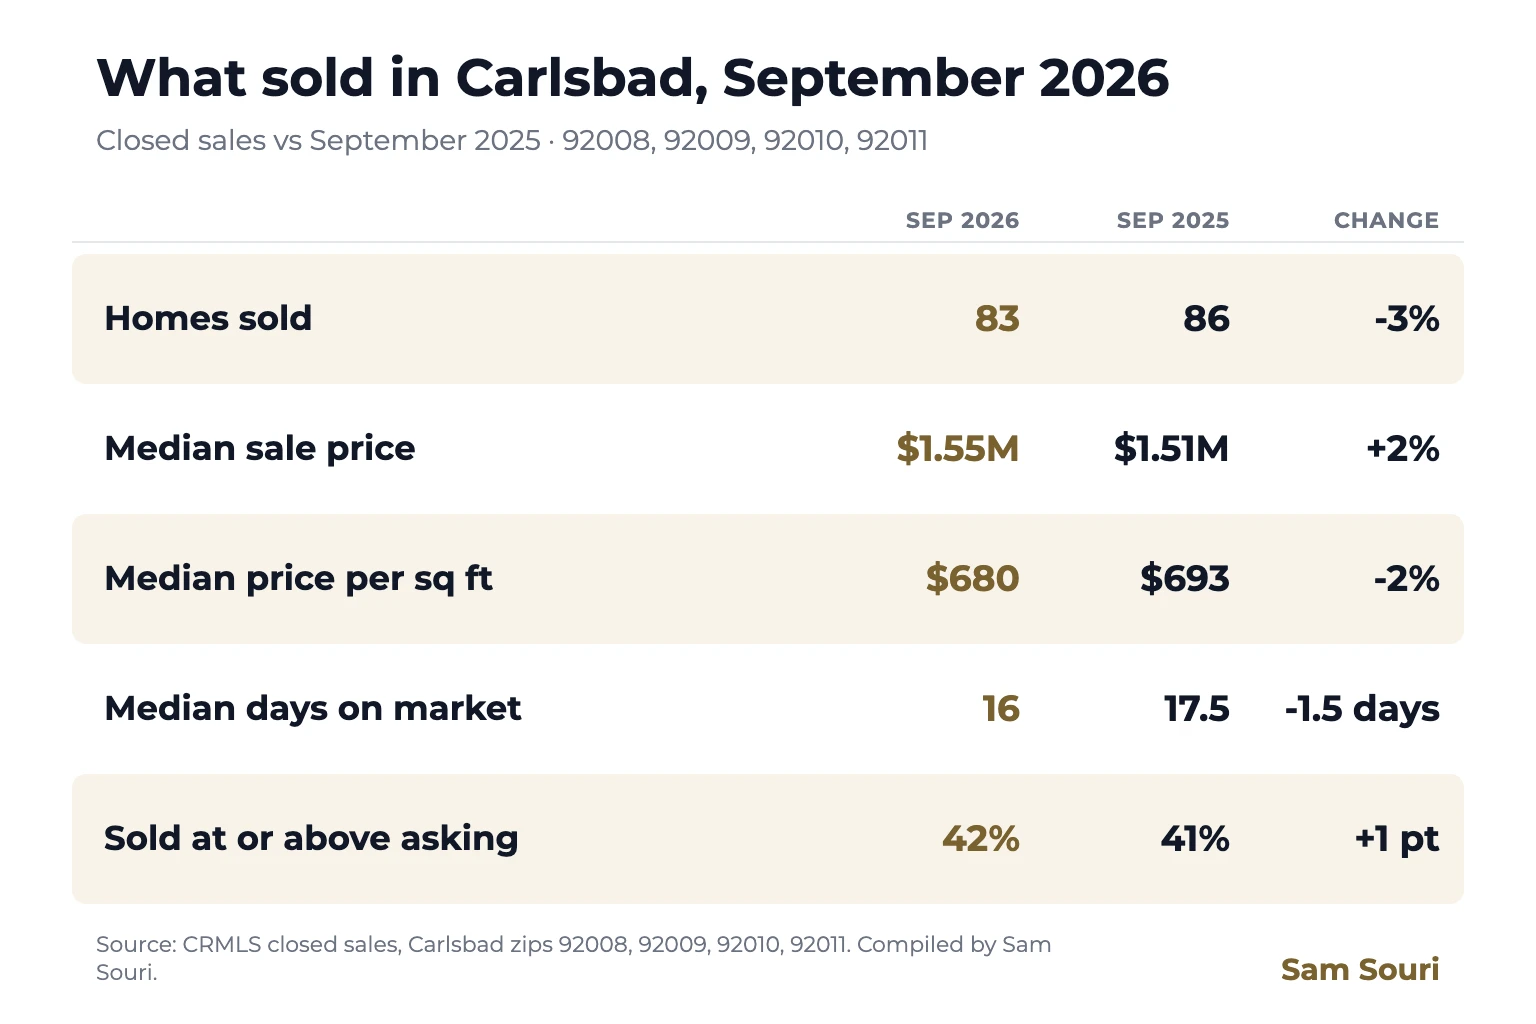
- Carlsbad closed 83 home sales in September 2026, against 86 in September 2025. The median sale was $1.55M, up 2% from a year earlier.
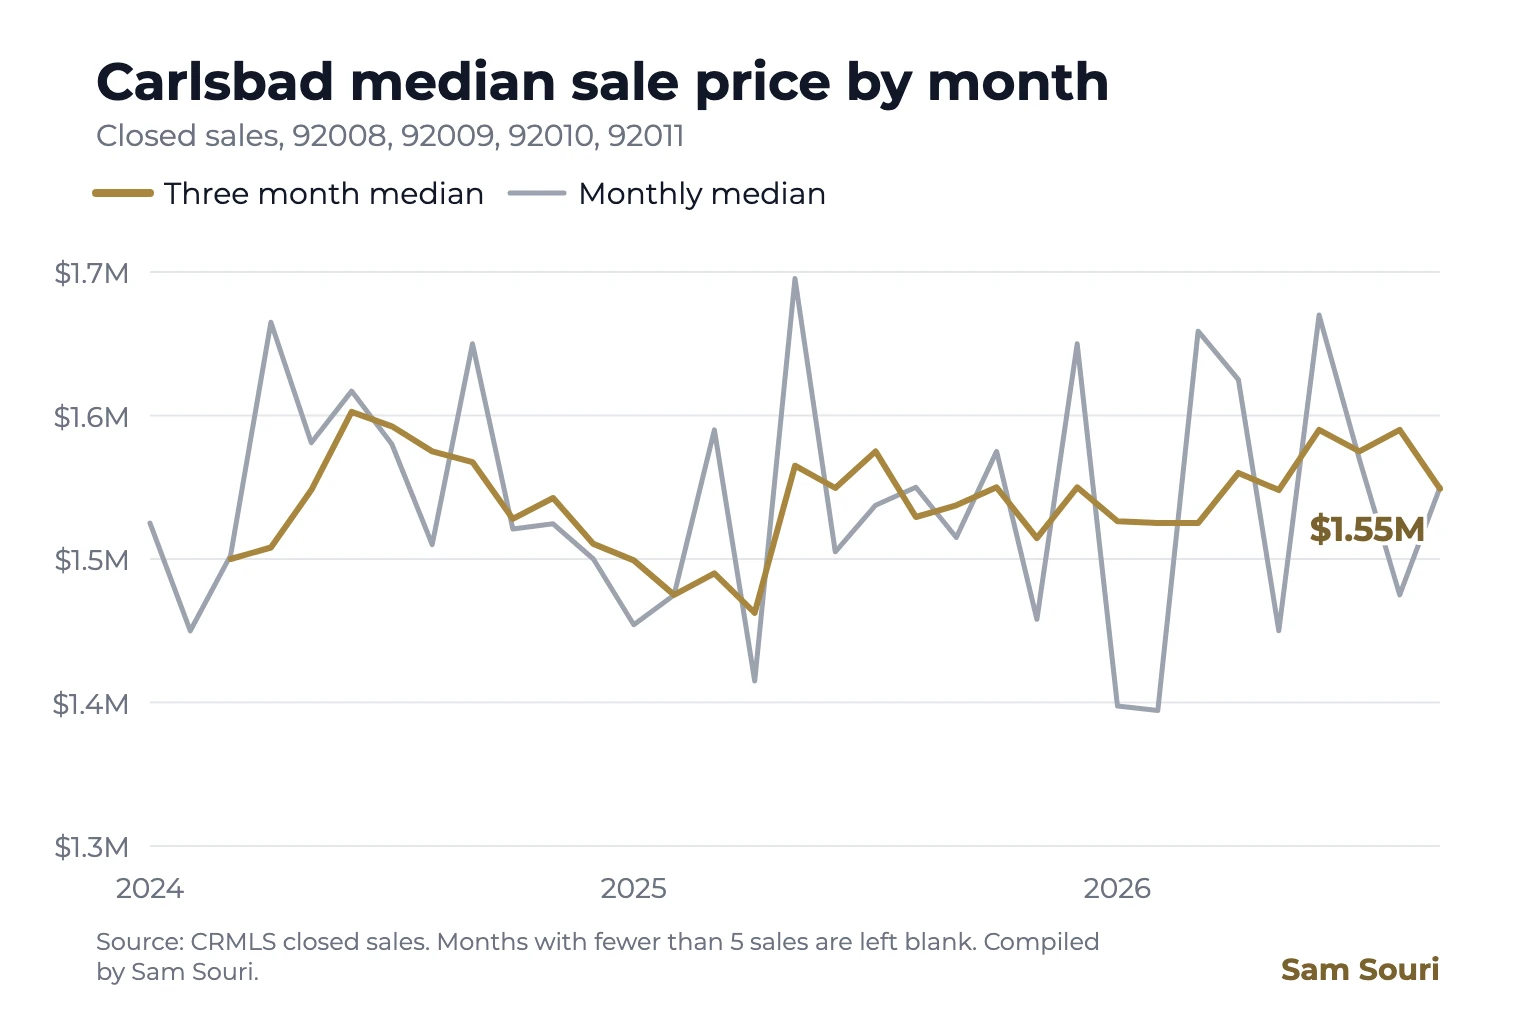
- Over the three months from July to September 2026 (321 sales, a steadier read than one month), the median was $1.55M, up 1%, and the median price per square foot was $696, down 1%.
- About one in three sellers (29%) cut their price before selling. Measured against the first list price, the median home sold for 97.4% of it.
How I measured this
These are closed sales reported to CRMLS for homes in Carlsbad, which I define by zip: 92008, 92009, 92010 and 92011. That covers houses, condos, townhomes and two to four unit buildings. September 2026 is a complete month. Each figure is compared with the same window a year earlier, and because one month of sales in one city is a small sample, I also show the three months from July to September 2026. Every median is taken across individual sales, a home posted twice in the MLS counts once, and every count (n) is shown so you can judge how much weight a number can carry.
The asking price is the last list price before the home went under contract. The first list price is the price the home came on the market at, so the gap between the two is the price cut. New construction means a home built in 2025 or 2026.
September 2026 in numbers
| Measure | Sep 2026 | Sep 2025 | Jul to Sep 2026 | Jul to Sep 2025 |
|---|---|---|---|---|
| Homes sold | 83 | 86 | 321 | 270 |
| Median sale price | $1,550,000 | $1,515,000 | $1,549,000 | $1,537,450 |
| Median price per sq ft | $680 | $693 | $696 | $700 |
| Median days on market | 16 days | 17.5 days | 18 days | 17 days |
| Sale to asking price (median) | 98.7% | 99.1% | 99.4% | 99.0% |
| Sold at or above asking | 42% | 41% | 45% | 39% |
| Sale to first list price (median) | 97.4% | n/a | 98.2% | n/a |
| Cut the price before selling | 29% | n/a | 31% | n/a |
The first list price comes from a closed sale field the MLS export only gives me for 2026 sales, so those two rows have no 2025 figure yet. Source: CRMLS closed sales and closed leases, compiled by Sam Souri.
The September median sale was $1,550,000 against $1,515,000 a year earlier (+2%), while the median price per square foot went from $693 to $680 (-2%). The two measures point in different directions, which usually means the mix of homes that sold changed (bigger or smaller homes, more houses or more condos), not that the same home is worth that much more or less. The median home was on the market 16 days, about the same as the 17.5 days a year earlier, and 42% of sales closed at or above the asking price (41% a year earlier).
Houses, condos and new construction
Three months is the shortest window where each kind of home has enough sales to compare, so this table covers July to September 2026. A change needs at least 10 sales in both years.
| Jul to Sep 2026 | Sales | Median price | Price per sq ft | Days on market | Median vs a year earlier |
|---|---|---|---|---|---|
| Houses | 189 | $1,950,000 | $774 | 13 days | +7% |
| Condos and townhomes | 130 | $852,500 | $610 | 30.5 days | -5% |
| Resale homes | 313 | $1,554,000 | $699 | 18 days | +3% |
| New construction | 8 | $1,099,567 | $598 | 39 days | n/a (8 a year earlier) |
A house sold for a median $1.95M and a condo or townhome for $853k, so a month heavy in one or the other moves the city median on its own. Eight of the 321 sales were new construction, at a median $1.1M.
Price cuts: what the first price really said
Sale to asking price flatters a market where sellers cut before they sell, because the asking price has already come down. Against the first list price, Carlsbad homes sold for a median 98.2% from July to September 2026 (320 sales). 31% of sellers cut at least once, and the median cut was 4.9% (98 sales). The median home spent 22 days on the market counting any earlier listing periods, against 18 days on the final listing alone.
| Days on market | Sales | Cut the price | Sale to first list price |
|---|---|---|---|
| 0 to 14 days | 143 | 0% | 100.0% |
| 15 to 30 days | 54 | 17% | 98.3% |
| 31 to 60 days | 63 | 60% | 95.2% |
| More than 60 days | 60 | 85% | 92.3% |
Homes that sold within 14 days closed at a median 100.0% of their first price. Homes on the market more than 60 days closed at 92.3%. The longer a home sat, the further below its first price it sold.
How buyers paid
Of the 321 sales from July to September 2026 with financing on record, 35% closed in cash, 57% with a conventional loan, 4% with a VA loan and 1% with FHA (3% other terms, such as private money or an assumed loan). 22% of sellers gave the buyer a credit toward closing costs or repairs, a median $5,000 (0.4% of the price, 71 sales). In 47% of sales the seller paid the buyer's agent, a median 2.5% of the price. At the sale, 60% of homes were lived in by the owner, 37% were vacant and 4% had a tenant (302 sales with occupancy on record). The median home went under contract 20 days after it came on the market and closed 26 days after that. Credits and the buyer's agent fee are what the listing agent reported in the MLS, so treat them as a floor.
Same home, then and now
A median compares different homes from one year to the next. A cleaner test is the same home sold twice. 115 of the 321 homes that sold from July to September 2026 had sold before (since 2019, same parcel and same unit). Leaving out 21 resold within 18 months and one whose recorded size changed by more than 10%, the other 93 had been held a median 4.5 years and resold for a median 24% more than their last price, about 5.2% a year. Over the same years the city median for the same kind of home rose 20%, so the same homes gained more than the headline median suggests. The 21 quick resales went for a median 34% more than their last price, the pattern of a renovation between sales, although seven resold within 5% of what the owner paid.
By zoned high school
310 of the 321 sales from July to September 2026 matched a zoned high school through the county parcel record. Zones come from district boundary maps, or where a district publishes none, from a mapped sample of assigned schools, so always confirm a specific address with the district. Schools with fewer than 5 sales are left out.
| Zoned high school | Sales | Median price | Price per sq ft |
|---|---|---|---|
| La Costa Canyon High (San Dieguito Union High) | 59 | $1,585,000 | $715 |
| Carlsbad High (Carlsbad Unified) | 199 | $1,560,000 | $746 |
| San Marcos High (San Marcos Unified) | 52 | $1,425,000 | $603 |
What rented in Carlsbad
I manage rentals too, so here is the other side of the market: 60 homes in the same zips leased from July to September 2026 (18 in September), from closed MLS leases. Gross yield is twelve months of the median rent divided by the median sale price for the same bedroom count, before taxes, insurance, HOA dues, repairs or vacancy. Rentals and sales are not the same homes, so read it as a rough guide.
| Bedrooms | Leases | Median rent | Sales | Median sale price | Gross yield |
|---|---|---|---|---|---|
| Studio or 1 bedroom | 3 | n/a | 10 | $584,000 | n/a |
| 2 bedrooms | 21 | $3,700 | 67 | $779,000 | 5.7% |
| 3 bedrooms | 20 | $4,673 | 105 | $1,373,000 | 4.1% |
| 4 bedrooms | 14 | $6,150 | 88 | $1,899,500 | 3.9% |
| 5 or more bedrooms | 2 | n/a | 51 | $2,200,000 | n/a |
A 3 bedroom home that sold for the median $1,373,000 would rent for about $4,673 a month at the median lease, a gross yield of 4.1% a year.
Notable September sales
Street and zip only. I never publish house numbers or owner names.
- Highest price: a house on Aviara Dr (92011), 3 bed, 5,460 sq ft, sold for $4,000,000 against an asking price of $4,475,000 after 82 days on the market.
- Lowest price: a condo on Quail Pl (92009), 2 bed, 1,040 sq ft, sold for $560,000.
- Furthest over asking: a house on Avondale (92008) listed at $1,875,000 and sold for $2,146,250, 14.5% over, after 6 days.
- Fastest sale: a house on Yosemite (92010), 3 bed, 1,855 sq ft, went under contract after 1 day on the market and sold for $1,460,000 (+4.3% vs asking).
For sale right now
On October 14, 2026, 232 homes were for sale in the same zips. At the 107 sales a month of the last three months, that is 2.2 months of supply. This is a count taken today, not at the end of September, so I don't compare it with last year. For context, Freddie Mac's national 30 year fixed rate averaged 6.86% in September, against 6.35% in September 2025. That is a national survey, not a Carlsbad figure.
What it means
Buyers: most homes closed below asking in September, so there is room to negotiate on homes that have been sitting. 31% of sellers had already cut their price, and the days on market table above shows where the discounts are. Credits are on the table too: 22% of sellers paid toward the buyer's closing costs or repairs.
Sellers: the median home sold for 98.2% of its first price, and the homes that sold within 14 days sold closer to it than the ones that sat. A price the market accepts in the first weeks usually beats leaving room to come down.
Owners thinking about renting it out: the gross yield on a median 3 bedroom home was 4.1% a year before costs, below the 6.86% average 30 year mortgage rate in September. Renting tends to pencil for owners with a low rate locked in or a lot of equity, so run the numbers with your own payment, not a new buyer's.
Sources: CRMLS closed sales and closed leases, compiled by Sam Souri. Sales and leases as reported to the MLS through September 30, 2026. Not an appraisal. Data is deemed reliable but not guaranteed.
Curious what your home would sell or rent for in Carlsbad?
Contact SamGet the monthly letter
San Diego market notes from Sam, plus investor insights from Prop2Profit.
1-2 emails a month. Unsubscribe anytime.