4S Ranch, Del Sur and Santaluz Home Prices Through September 2026: 4% Under Last Year, but 3 of 5 Communities Rose
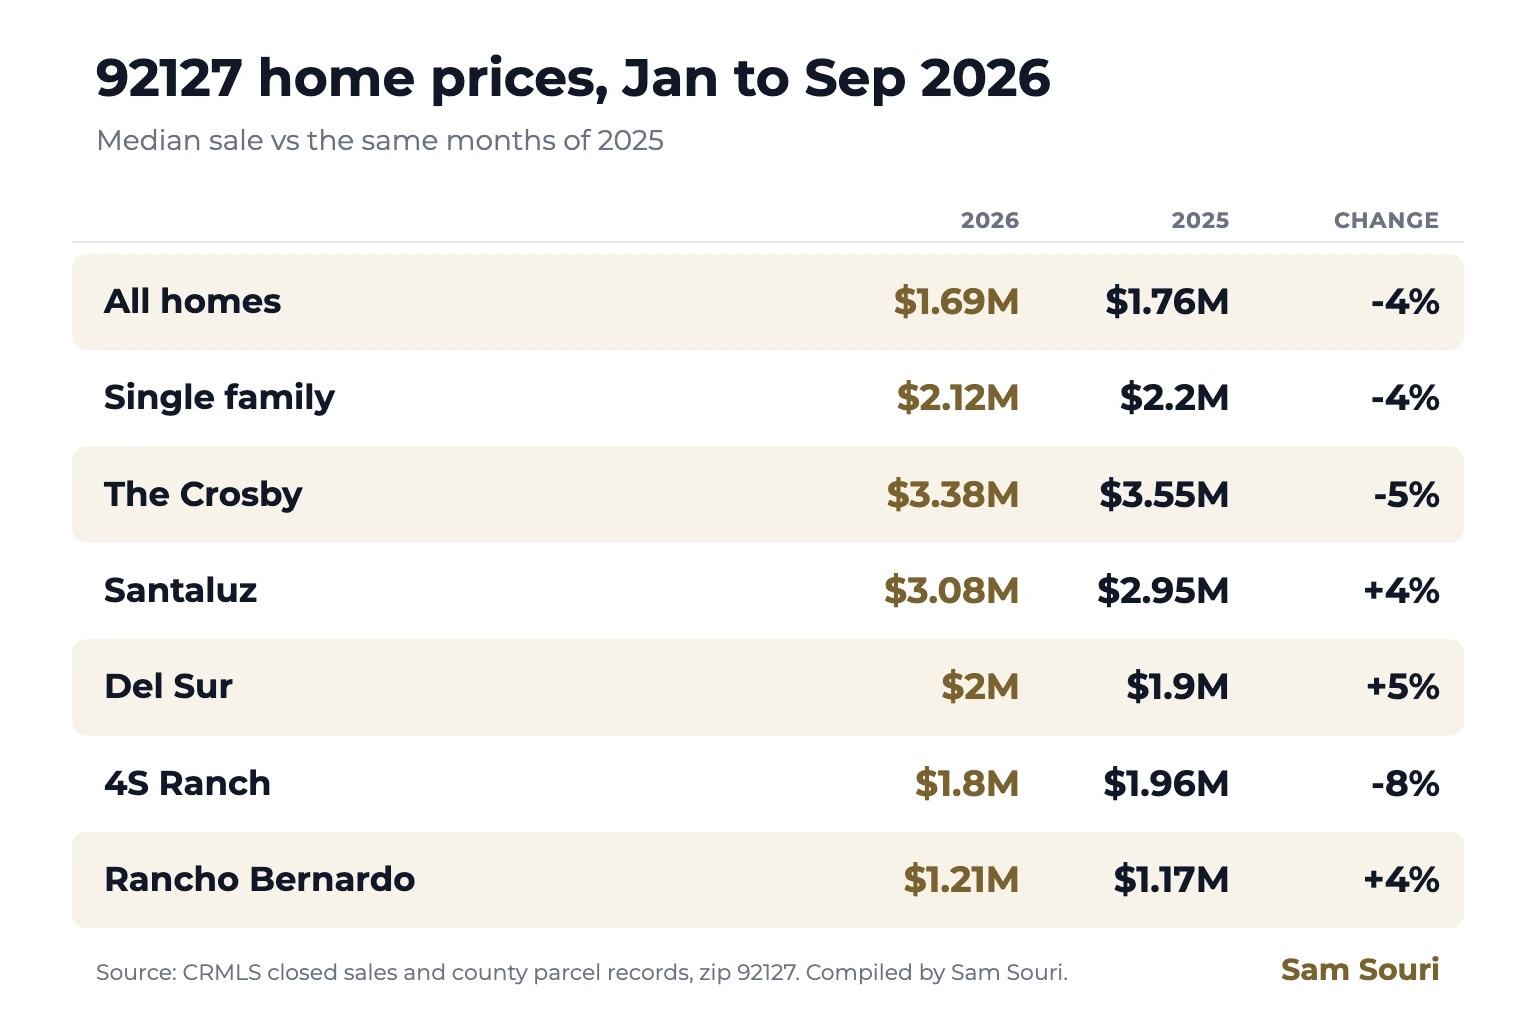
- 92127 homes (4S Ranch, Rancho Bernardo, Del Sur, Santaluz, The Crosby) sold for a median $1.69M from January to September 2026, on 294 sales, against $1.76M on 278 sales in the same months of 2025 (-4%).
- Single family homes alone sold for a median $2.12M on 216 sales, against $2.2M on 212 (-4%).
- 3 of 5 communities rose: Rancho Bernardo +4%, Del Sur +5%, Santaluz +4%. 4S Ranch -8%, The Crosby -5% set the zip's -4%.
How I measured this
These are closed sales reported to CRMLS in zip 92127: houses, condos, townhomes and two to four unit buildings, with single family homes also shown on their own. The window is January to September 2026, a complete stretch of months, compared with the same months of 2025. I lead with that window rather than one month: 92127 runs from condos to estates, so a single month moves on which homes happened to close. A change is shown only when both years have at least 10 sales.
Each sale is placed in its community by its county parcel (the parcel's jurisdiction, its recorded subdivision and its location), never by the listing text. 4S Ranch and The Crosby are unincorporated county. Del Sur and Santaluz are the north and south of Black Mountain Ranch. Rancho Bernardo is the City of San Diego tracts on the zip's east side. That places 257 of the 294 sales this year. The rest sit on the zip's edges or lack a parcel match, and they still count in the zip totals. The long view starts in 2020, because CRMLS carried San Diego thinly before mid 2020.
January to September 2026 against 2025
All homes
| Jan to Sep | 2026 | 2025 |
|---|---|---|
| Homes sold | 294 | 278 |
| Median sale price | $1.69M | $1.76M |
| Median price per sq ft | $669 | $703 |
| Median days on market | 14 days | 17 days |
| Sold at or over asking | 43% | 44% |
| Sale to asking price (median) | 99.2% | 99.1% |
Single family homes
| Jan to Sep | 2026 | 2025 |
|---|---|---|
| Homes sold | 216 | 212 |
| Median sale price | $2.12M | $2.2M |
| Median price per sq ft | $704 | $736 |
| Median days on market | 13 days | 17 days |
| Sold at or over asking | 41.9% | 42.2% |
| Sale to asking price (median) | 98.9% | 98.7% |
Price per square foot moved -5% for all homes and -4% for single family. That is the same direction as the medians, so this is a change in price, not only in which homes sold.
Quarter by quarter
| All homes | 2026 | 2025 | Change | Sales |
|---|---|---|---|---|
| Jan to Mar | $1.91M | $1.98M | -4% | 89 |
| Apr to Jun | $1.63M | $1.81M | -10% | 108 |
| Jul to Sep | $1.56M | $1.62M | -4% | 97 |
| Single family | 2026 | 2025 | Change | Sales |
|---|---|---|---|---|
| Jan to Mar | $2.28M | $2.29M | flat | 64 |
| Apr to Jun | $2.16M | $2.08M | +4% | 76 |
| Jul to Sep | $1.93M | $2.08M | -7% | 76 |
A single month can mislead here: September alone, for single family homes, was -22%. On 20 sales. 92127 runs from condos to estates, so one month swings on which homes closed. I read the year, -4%.
By community
92127 is five different markets. 3 of 5 communities rose. Rancho Bernardo +4%, Del Sur +5%, Santaluz +4%. 4S Ranch -8%, The Crosby -5% set the zip's -4%.
| All homes, Jan to Sep | 2026 median | 2025 median | Change | 2026 sales |
|---|---|---|---|---|
| The Crosby | $3.38M | $3.55M | -5% | 27 |
| Santaluz | $3.08M | $2.95M | +4% | 31 |
| Del Sur | $2M | $1.9M | +5% | 39 |
| 4S Ranch | $1.8M | $1.96M | -8% | 87 |
| Rancho Bernardo | $1.21M | $1.17M | +4% | 73 |
For single family homes alone, 4S Ranch -12% led the drop. Del Sur went the other way at +7%. Each community is its own market, so ask me for yours.
| Single family, Jan to Sep | 2026 median | 2025 median | Change | 2026 sales |
|---|---|---|---|---|
| The Crosby | $3.38M | $3.55M | -5% | 27 |
| Santaluz | $3.08M | $3.1M | -1% | 25 |
| Del Sur | $2.08M | $1.95M | +7% | 38 |
| 4S Ranch | $2.02M | $2.28M | -12% | 59 |
| Rancho Bernardo | $1.33M | $1.37M | -3% | 48 |
The community rows place 257 of 294 sales for all homes and 197 of 216 for single family.
The long view
Since 2020 the median is +67% for all homes and +67% for single family.
| Year | All homes median | Sales | Single family median | Sales |
|---|---|---|---|---|
| 2020 | $1.01M | 428 | $1.27M | 295 |
| 2021 | $1.24M | 840 | $1.6M | 577 |
| 2022 | $1.4M | 486 | $1.94M | 324 |
| 2023 | $1.36M | 395 | $1.88M | 278 |
| 2024 | $1.66M | 413 | $2.23M | 275 |
| 2025 | $1.64M | 351 | $2.1M | 259 |
| 2026 Jan to Sep | $1.69M | 294 | $2.12M | 216 |
Full years, except 2026, which covers January to September. The 2025 row is the whole year. The comparison at the top uses January to September 2025: $1.76M for all homes and $2.2M for single family.
What it means
- Price per sq ft -5%. The median and the price per foot agree on the direction.
- 14 days on market. Against 17 days in 2025, and 43% sold at or over asking.
- 4S Ranch -12% led the drop. Del Sur went the other way at +7%. Each community is its own market, so ask me for yours.
- For sellers: buyers here compare your home with the latest sales in your own community, not the zip median. Price from those.
- For buyers: 43% of homes sold at or over asking and the median home sold in 14 days, so the well priced ones still move fast.
Sources: CRMLS closed sales and San Diego County parcel records, compiled by Sam Souri. Sales as reported to the MLS through September 2026. Not an appraisal. Data is deemed reliable but not guaranteed.
Curious what your home in 4S Ranch, Rancho Bernardo, Del Sur, Santaluz or The Crosby would sell for today?
Contact SamGet the monthly letter
San Diego market notes from Sam, plus investor insights from Prop2Profit.
1-2 emails a month. Unsubscribe anytime.