Bressi Ranch Home Prices Through September 2026: 1% Under Last Year
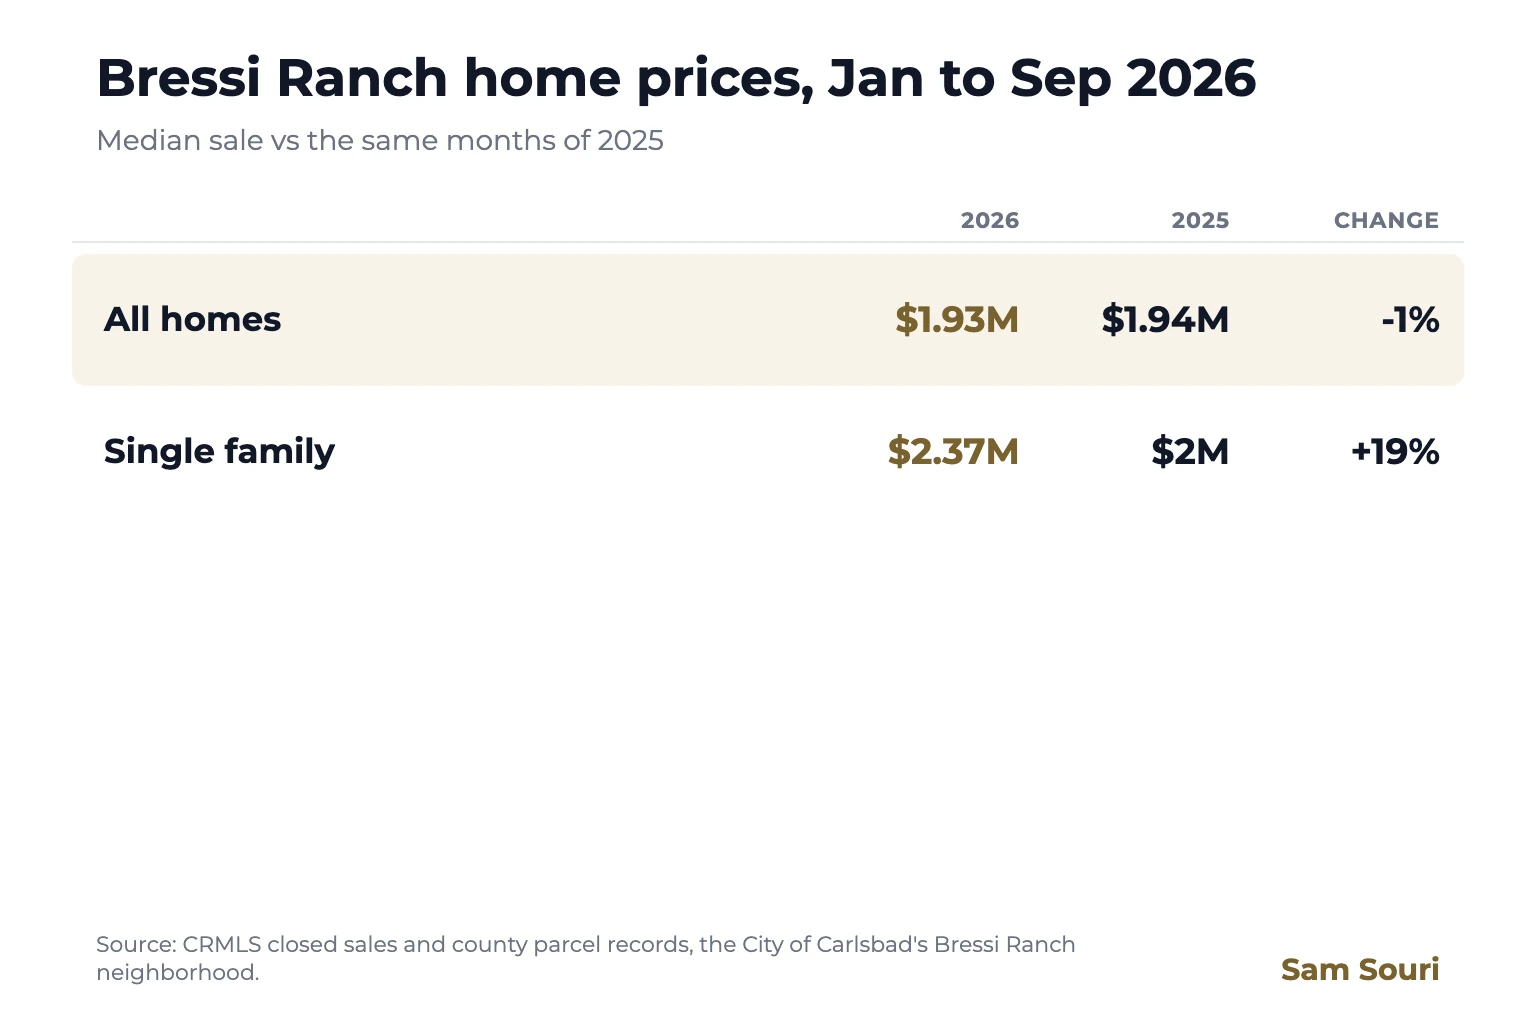
- Bressi Ranch homes sold for a median $1.93M from January to September 2026, on 15 sales, against $1.94M on 20 sales in the same months of 2025 (-1%).
- Single family homes sold for a median $713 a square foot on 11 sales, against $736 on 14 (-3%). With this few sales their median sale ($2.37M, against $2M) tracks the size of the homes that sold, so I read price per foot.
- 15 sales, a small sample: Against 20 in 2025. A single sale moves a median this small, so ask me for the homes behind it.
How I measured this
These are closed sales reported to CRMLS in the City of Carlsbad's Bressi Ranch neighborhood: houses, condos, townhomes and two to four unit buildings, with single family homes also shown on their own. The window is January to September 2026, a complete stretch of months, compared with the same months of 2025. I lead with that window rather than one month, because a single month moves on which homes happened to close. A change is shown only when both years have at least 10 sales.
Bressi Ranch is defined by the City of Carlsbad's own neighborhood boundary: every sale on one of its 924 parcels counts, whatever the listing calls it. With 15 sales this year it is a small market, so one or two homes move a median, and I say so wherever it matters. The long view starts in 2020, because CRMLS carried San Diego thinly before mid 2020.
January to September 2026 against 2025
All homes
| Jan to Sep | 2026 | 2025 |
|---|---|---|
| Homes sold | 15 | 20 |
| Median sale price | $1.93M | $1.94M |
| Median price per sq ft | $655 | $706 |
| Median days on market | 9 days | 15 days |
| Sold at or over asking | 60% | 58% |
| Sale to asking price (median) | 100.0% | 100.0% |
Single family homes
| Jan to Sep | 2026 | 2025 |
|---|---|---|
| Homes sold | 11 | 14 |
| Median sale price | $2.37M | $2M |
| Median price per sq ft | $713 | $736 |
| Median days on market | 7 days | 15 days |
| Sold at or over asking | 55% | 54% |
| Sale to asking price (median) | 100.0% | 100.0% |
Price per square foot moved -7% for all homes and -3% for single family. Where it moves against the median, the mix of homes that sold changed more than their value did.
The long view
Since 2020 the median is +53% for all homes and +88% for single family, and single family price per foot is +73%.
| Year | All homes median | Sales | Single family median | Single family per sq ft | Sales |
|---|---|---|---|---|---|
| 2020 | $1.26M | 29 | $1.26M | $413 | 29 |
| 2021 | $1.48M | 29 | $1.61M | $548 | 20 |
| 2022 | $2M | 20 | $2.2M | $690 | 14 |
| 2023 | $1.63M | 16 | $1.9M | $677 | 13 |
| 2024 | $1.86M | 30 | $2.13M | $672 | 22 |
| 2025 | $1.94M | 27 | $2.06M | $725 | 18 |
| 2026 Jan to Sep | $1.93M | 15 | $2.37M | $713 | 11 |
Full years, except 2026, which covers January to September. The 2025 row is the whole year. The comparison at the top uses January to September 2025: $1.94M for all homes and $2M for single family ($736 a square foot).
What it means
- Condos joined in 2021. Bressi Ranch's condos and townhomes on Colt Place were built in 2019 and 2020, so the all homes median includes them from 2021.
- Price per sq ft -7%. The median and the price per foot agree on the direction.
- 11 sales, a small sample. Against 14 in 2025. A single sale moves a median this small, so ask me for the homes behind it.
- For sellers: buyers here compare your home with the latest sales on your own street and floor plan, not the neighborhood median. Price from those.
- For buyers: 60% of homes sold at or over asking and the median home sold in 9 days, so the well priced ones still move fast.
Sources: CRMLS closed sales and San Diego County parcel records, compiled by Sam Souri. Sales as reported to the MLS through September 2026. Not an appraisal. Data is deemed reliable but not guaranteed.
Curious what your Bressi Ranch home would sell for today?
Contact SamGet the monthly letter
San Diego market notes from Sam, plus investor insights from Prop2Profit.
1-2 emails a month. Unsubscribe anytime.